If you have limited coding knowledge, you might take one look at developer tools and think,"Nope."

I don't blame you.
A few years ago, the rare times I ended up on devtools was because I accidentally pressed something on my keyboard. I would frantically look for the "X" icon, thinking that it was only a matter of time before I broke something on my computer. Then, let out a sigh of relief once I found the "X," as if there had been a secret countdown ticking away.
For context, I did theater for years, so I always lean toward the dramatic.
Turns out, devtools aren't nearly as intimidating as they seem. While they're designed for developers, marketers, designers, and other non-developers can also use them to run audits and test website changes.
Let's cover the various ways to use Chrome DevTools and go through some steps to optimize your website.
What are developer tools?
Developer tools, often called devtools, allow you to inspect, test, and debug code on a browser that impacts the user interface. Marketers, SEO specialists, and designers can also use devtools to test changes and optimize their webpages.
Before we get into how to use Chrome DevTools, let's cover a few things you should know:
- HTML, CCS, and JavaScript run on browsers so they are the three languages that you will work with on Chrome Developer Tools.
- Anyone can use browser devtools and manipulate the code. However, the changes will only appear on your browser and will be gone once you refresh the page. Browser devtools help you identify what changes you need to make. To make those changes permanent, you'll have to go access the code on the back end.
How To Open Chrome Developer Tools
- Right-click to inspect the page.
- The Chrome DevTools window will open.
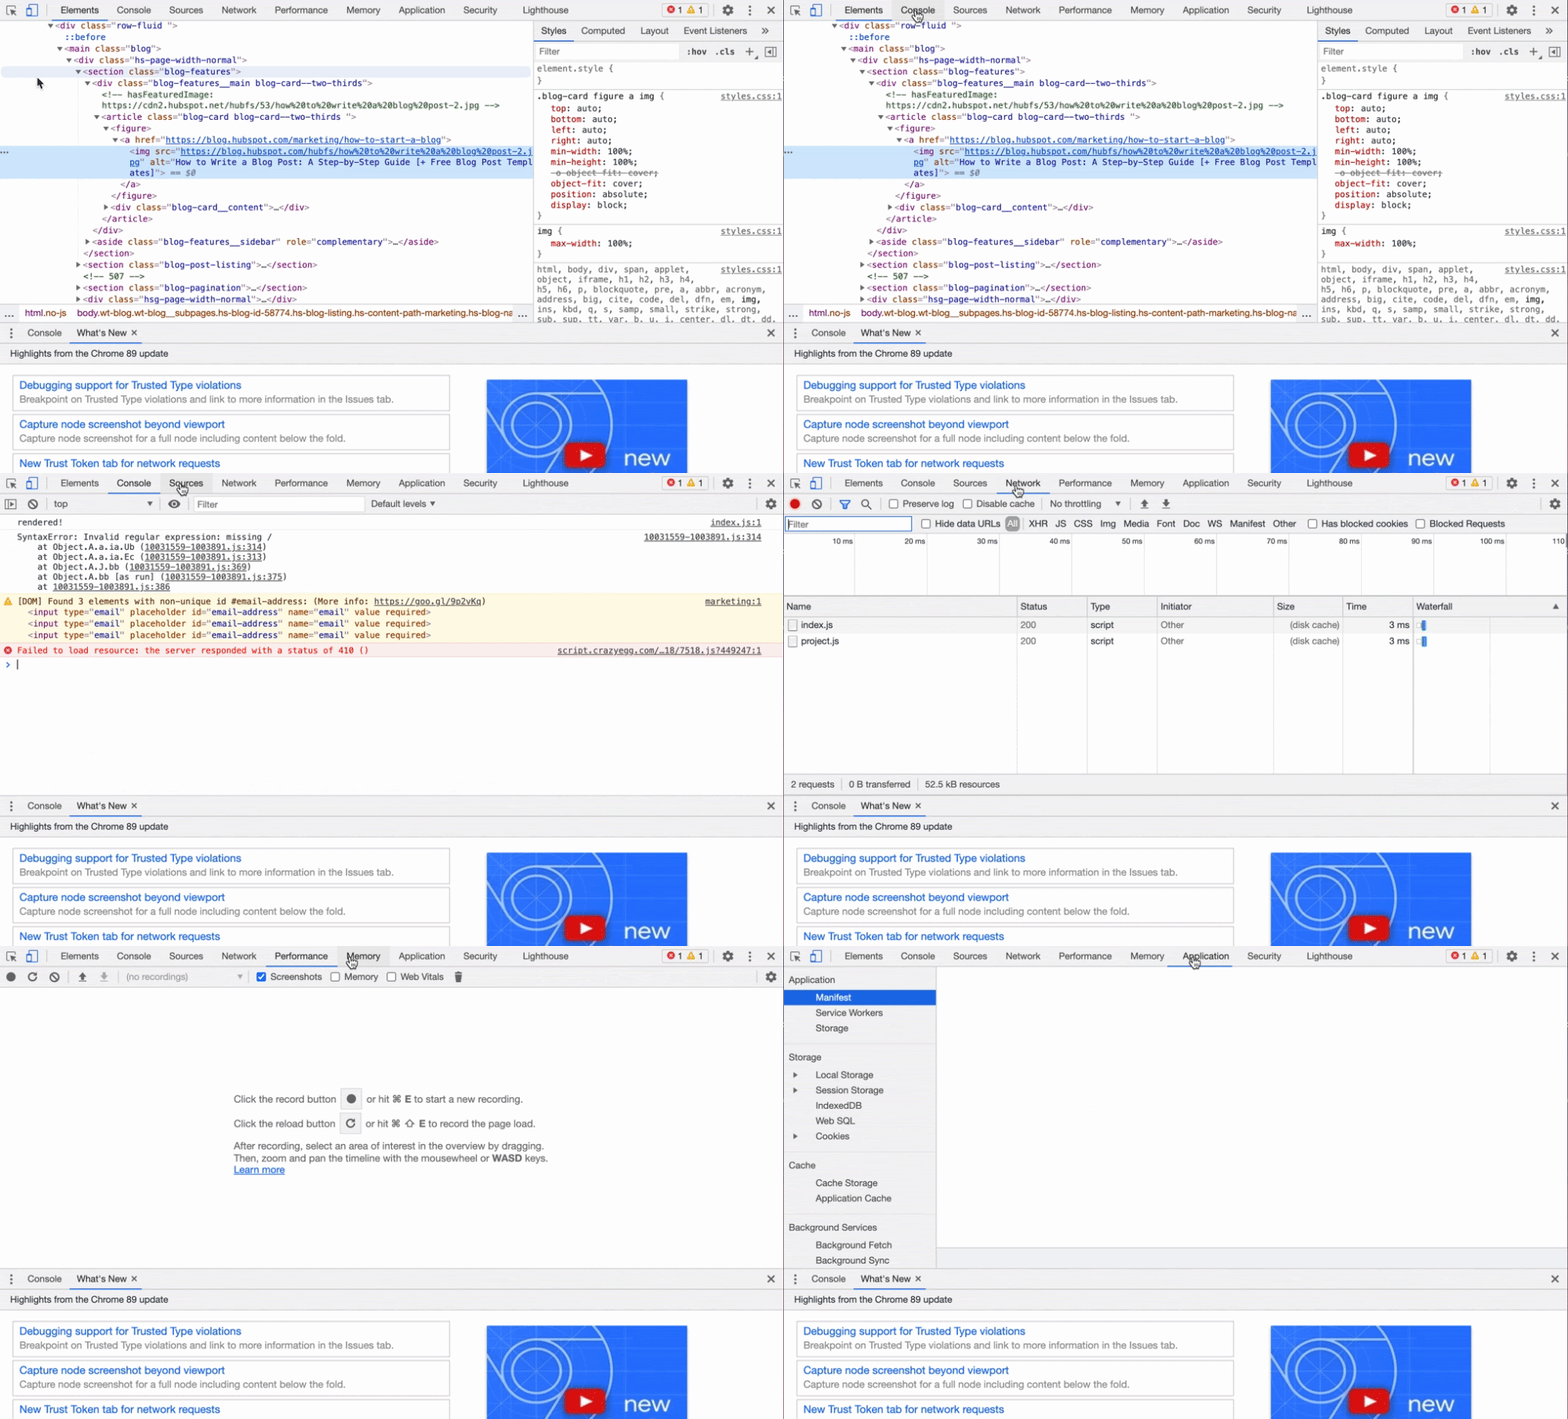
- Click on each tab to access the tools.
1. Right-click to inspect the page.
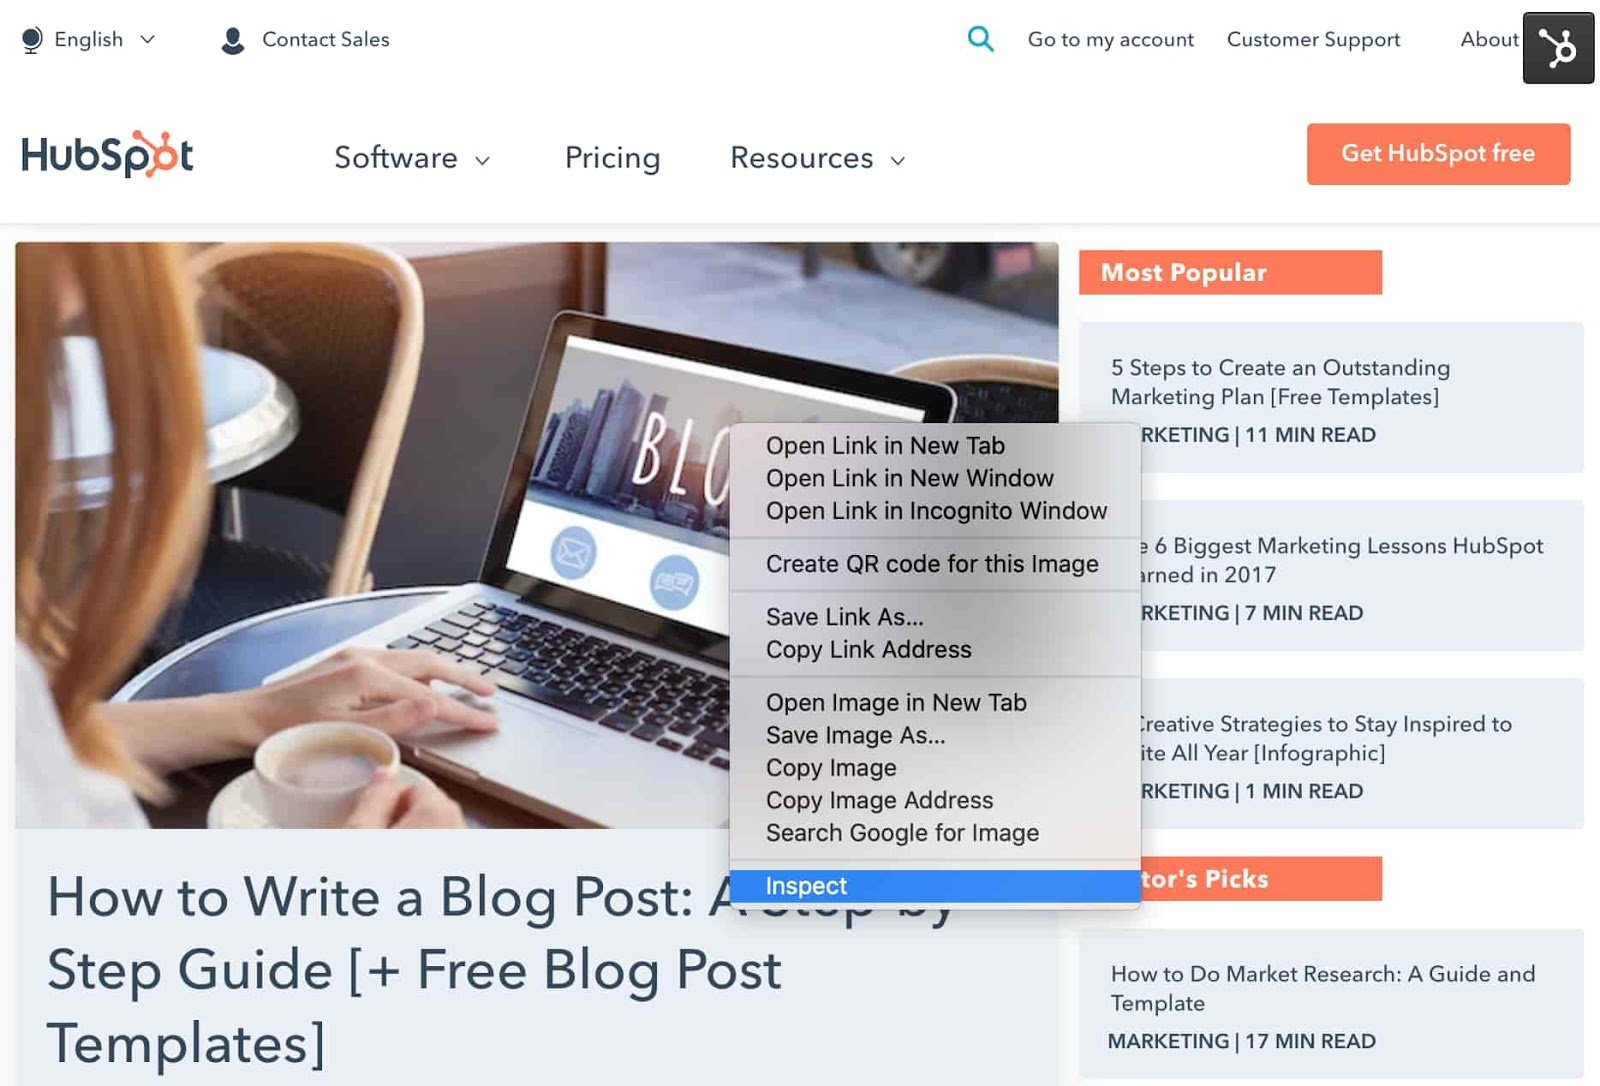
Right-click on the webpage you want to inspect. As a shortcut, you can also press "Command+Option+C" on Mac or "Control+Shift+C" on Windows, Linux, and Chrome OS. Then, click on "Inspect."
2. The Chrome DevTools window will open.
Navigate each panel by clicking on the tab located on the top of the screen. Jump to this section for an overview of the top devtools.
3. Click on each tab to access the tools.
Once you're done using Chrome DevTools, you can close it by clicking on the "X" symbol located on the top right of the window.
How To Use Chrome Developer Tools Without Coding Experience
Most web browsers have their own developer tool kit and there's a lot of overlap in the features. On Chrome DevTools, here are the top features:
- A device preview to test your webpage's responsive design
- A JavaScript debugger to identify and fix bugs
- A network panel to track and analyze page requests
- An inspector tool to make styling changes, such as font, spacing, colors, margins
- A console to identify page errors and warnings
- A performance panel to check your website performance, such as page speed
Here are a few ways to use Chrome Developer Tools.
Test your responsive design with Mobile Chrome Developer Tools.
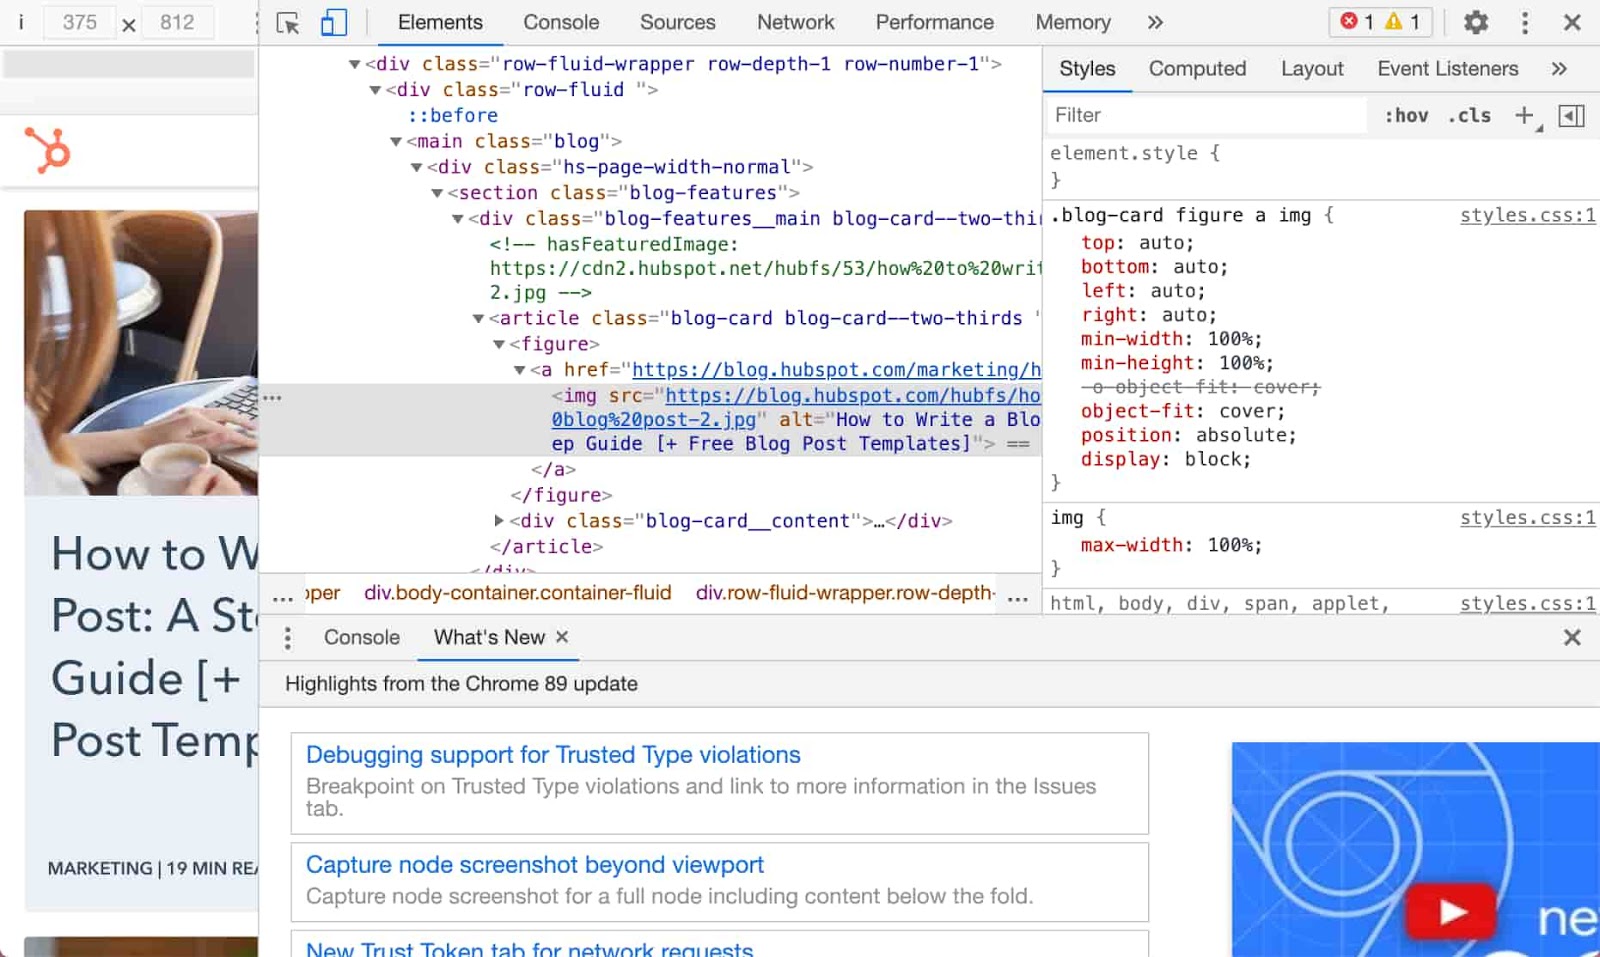
The Toggle Device Toolbar on Chrome DevTools allows you to see how your webpage looks on various devices, including iPhone models, iPads, and laptops. You can even add custom dimensions if a particular device isn't featured in the list.
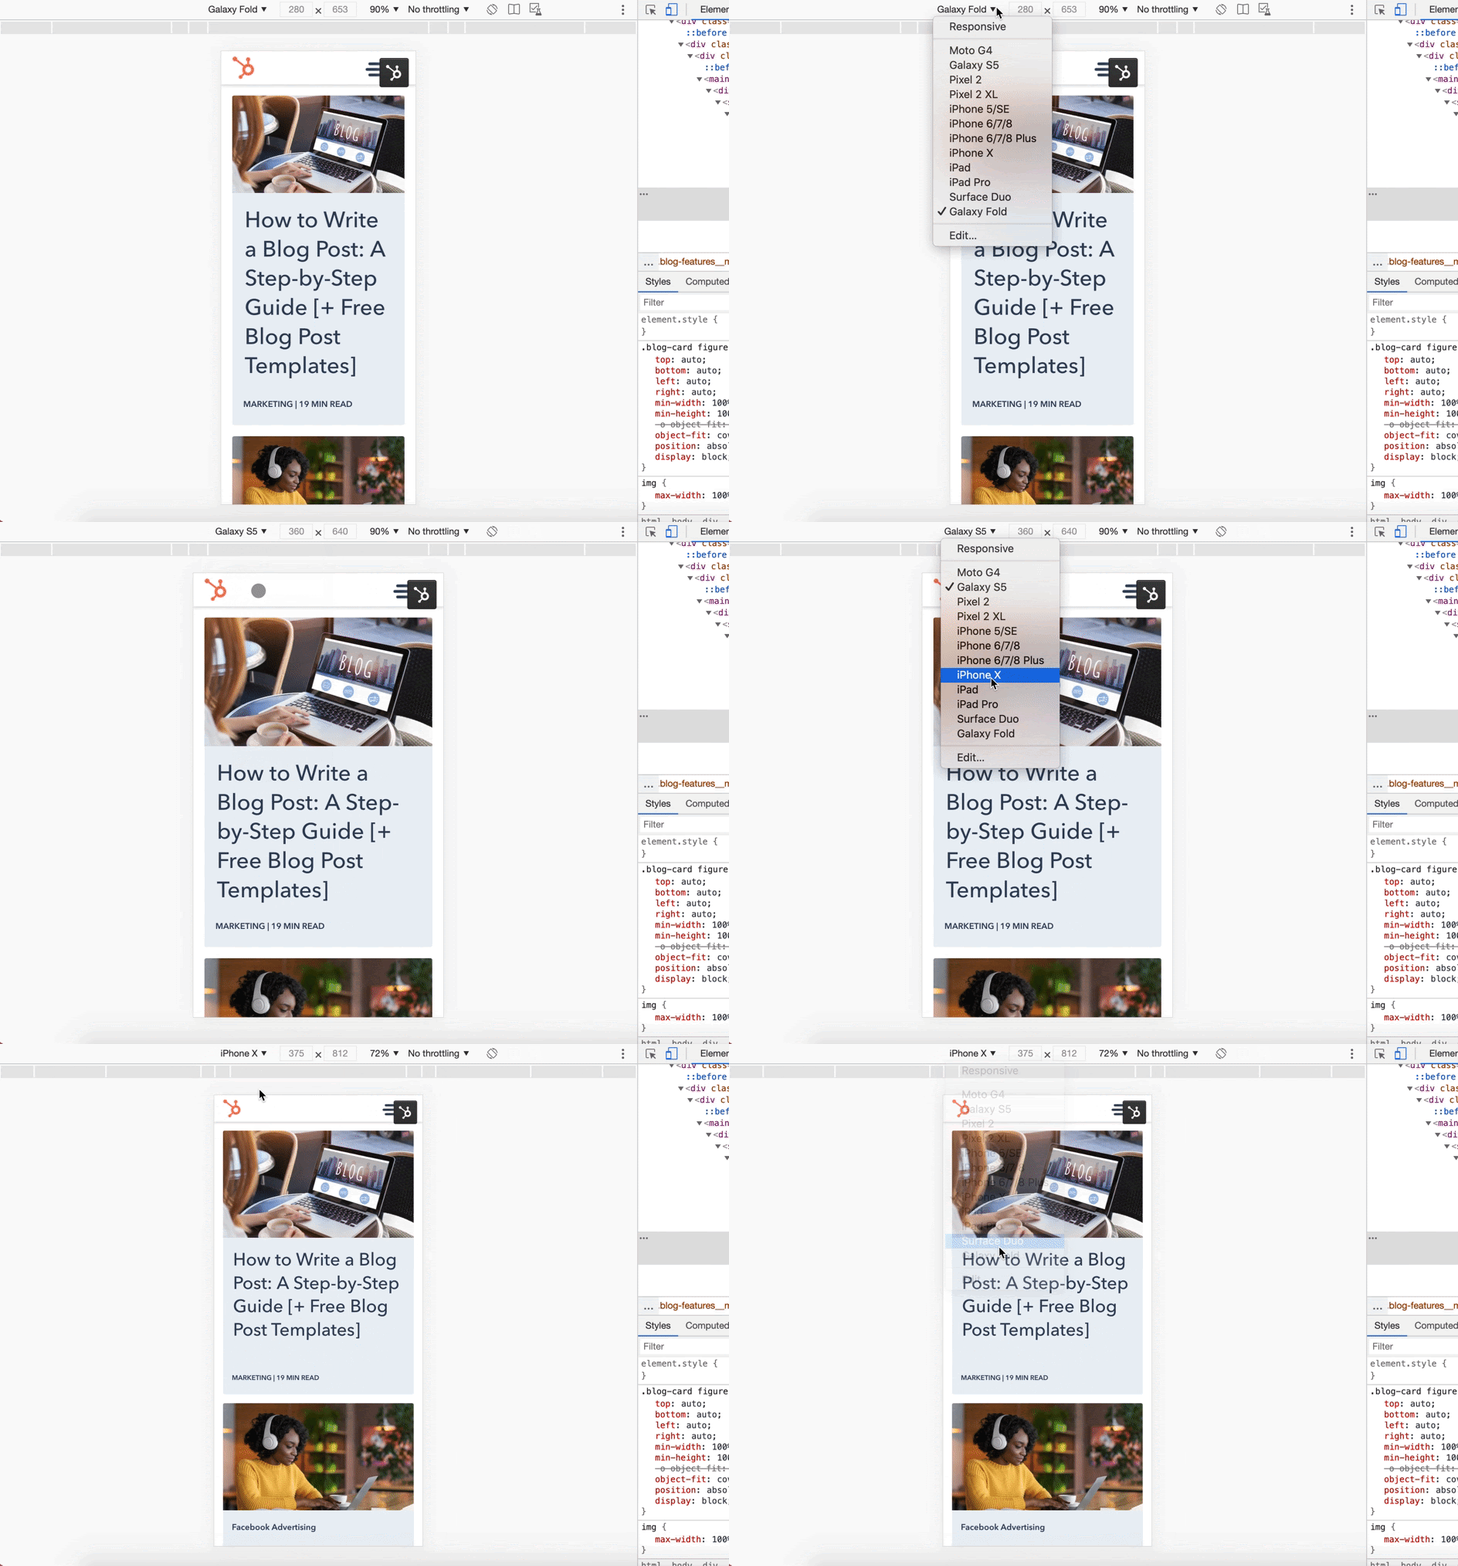
During an initial web development phase or a redesign, this toolbar can help your team visualize how your page renders on different viewports.
It can be especially useful to assess the user experience on your page.
For instance, say your data tells you that on mobile, users spend half the time on your blog posts than they do on desktop. When comparing one post on mobile versus desktop, you may find that the paragraphs are too long and bulky, creating a negative reading experience.
The easy fix here would be writing shorter paragraphs and adding more visuals to break up the text.
Using this same toolbar, you can also test how users with a slower connection experience your page loading.
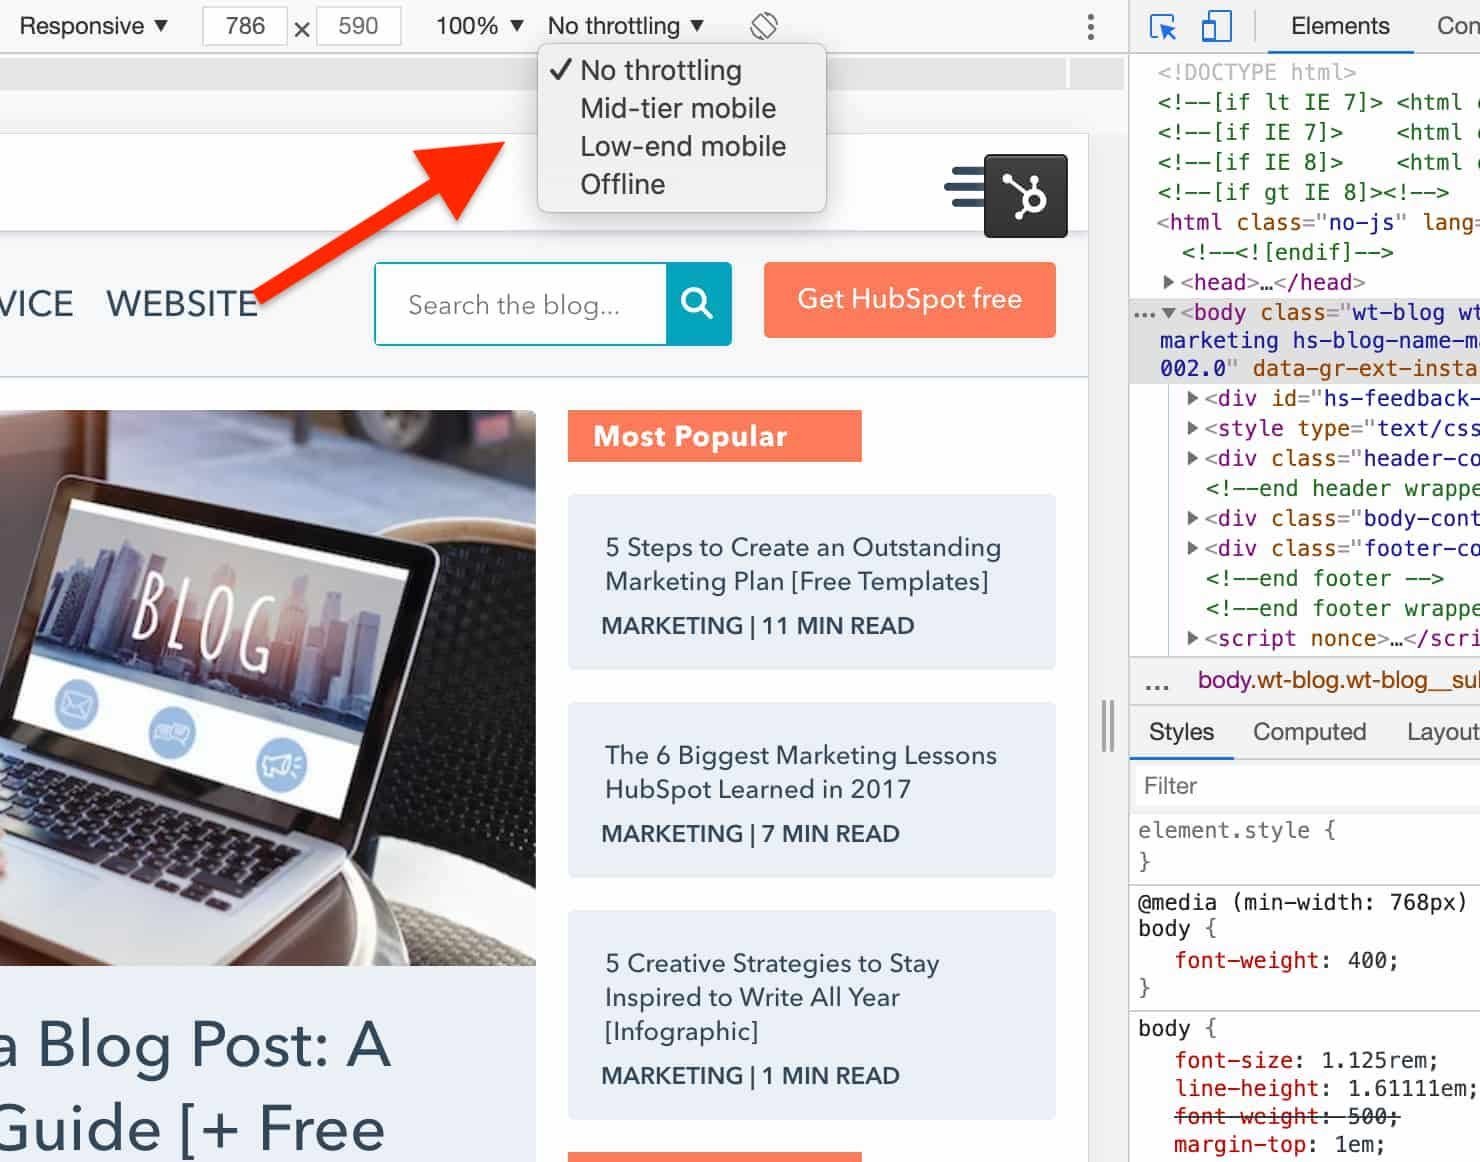
"No throttling" means there is no interruption on the connection. A mid-tier to low-end mobile will take longer to show all the elements on the page. If you're completely offline, you'll see the "no internet" error code.
Why is this useful? You want your users to have a positive experience on your site, no matter their connection. By seeing how your page loads, you may identify areas for improvement.
Measure and optimize your site speed.
For this step, we'll be using Lighthouse, an open-source Google product that evaluates webpage performance and presents opportunities for improvement. You can run it on Chrome DevTools to test everything from site speed and SEO to accessibility on both mobile and desktop.
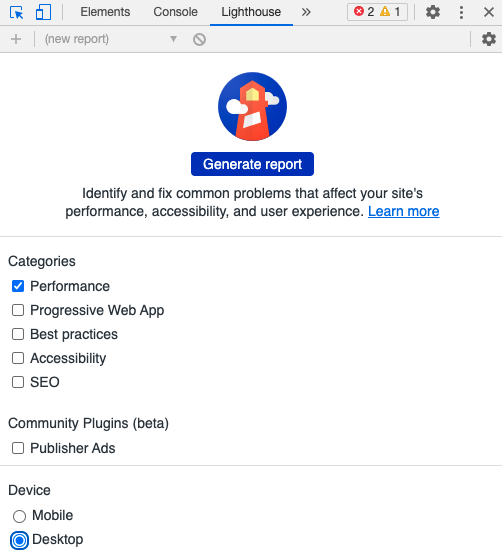
Page speed plays a big role in your ranking and should be a top priority when running an SEO audit.
To check your page speed using Lighthouse, refer to the picture above. Select "Performance" and whichever device you want to test on. Then, click on "Generate report." Once the results display, focus on the "Speed Index."
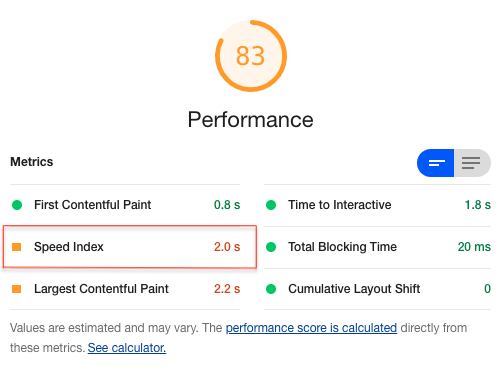
A good or fast speed index is between 0 and 4.3 seconds. A moderate one will fall between 4.4 and 5.8 seconds. If your index is over 5.8 seconds, your page is slow and will need some fixes to improve the page speed.
Another section to pay attention to as you scroll down is "Opportunity," this will list ways to reduce your page load speed.

In addition to impacting your SEO, page speed can also lead to high bounce rates. If you want to reduce your page loading time, the Lighthouse tool is a great place to start.
Preview your design changes.
If your team wants to visualize how certain aesthetic changes will look on your website, a quick and easy way is by using the inspector tool to manipulate the code.
To get started, click on your "Inspect" tool.

Then, hover around any element on the page to get details on the page styling.
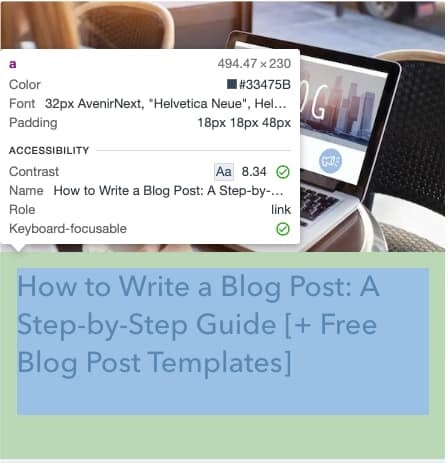
To make changes to the styling, select the element you want to edit. The "Elements" panel will jump to that element's HTML and CSS code. The "Styles" tab is what you want to focus on.
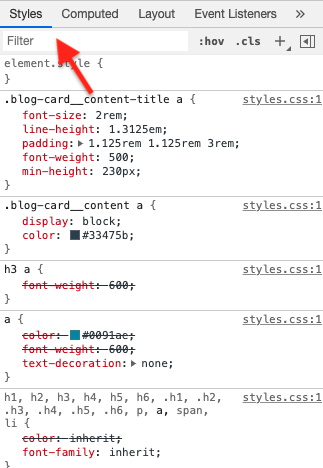
Here's an example of how to change the text color.

Run an SEO audit.
Every brand wants to rank on search engines because it means reaching more people and getting more traffic to your site.
To make sure your website maintains a high position, conduct regular audits to catch anything that could cause your page to drop in ranking. With Chrome DevTools, you can run an audit on Lighthouse to check what could be affecting your ranking.
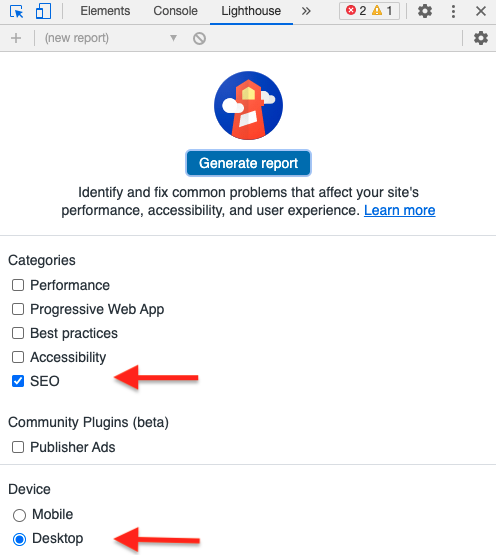
To start, click on the Lighthouse tab. Select "SEO" under categories and the device you'd like to focus on. Then, click "Generate report."
The report will show you your successful audits and opportunities for improvement.
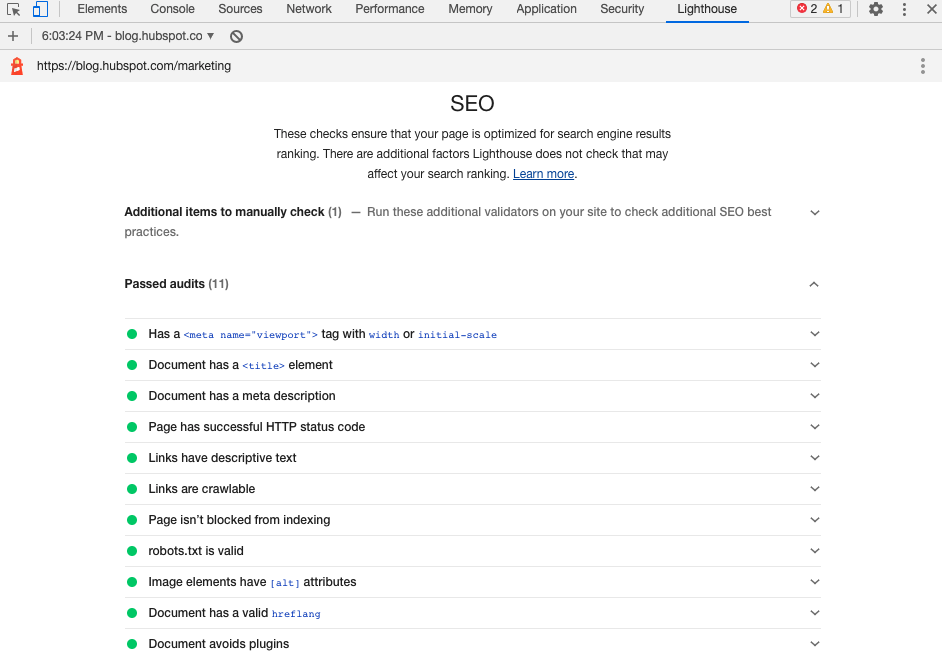
Although this SEO audit is not comprehensive, it's a great place to get a quick overview of your site's SEO performance.
Monitor your Google Analytics requests.
If you're tracking your website and marketing campaigns on Google Analytics, the last thing you want is dirty data.
Using Chrome DevTools, you can monitor the requests from Google Analytics and see if they are correctly reported on the Analytics Dashboard. Doing so will ensure you're collecting accurate data and help you identify errors.
Here are the steps:
- Click on the "Network" tab.
- Load your webpage.
- Find the Google Analytics requests, they will always begin with "__utm.gif"
- Click on the request to see what information is included in the request.
Once you know where to look, Chrome Developer Tools can be pretty easy to use. While some coding knowledge is helpful, it's not necessary to have success with the tool.
![→ Download Now: SEO Starter Pack [Free Kit]](https://no-cache.hubspot.com/cta/default/53/1d7211ac-7b1b-4405-b940-54b8acedb26e.png)


![How to Make Your Blog Posts SEO-Friendly [Checklist]](https://blog.hubspot.com/hs-fs/hub/53/file-511940152-png/seopanel_1-1.png)