This sentence will take you about two seconds to read. That’s also the longest the average internet user expects to wait for a page to load.
Two seconds may not seem like very long. But, when we’re in the flow of browsing, even an extra second of wait time can feel like an inconvenience. It’s not our fault either — over time, we’ve become used to blazing fast internet speeds. Our favorite websites spend substantial time and resources tweaking their web pages to load, or perform, as fast as technologically possible.
Why? Because page speed affects everything, from user experience, to brand perception, to conversions, to revenue. Whether you run an ecommerce site, a business website, or a simple blog, every one of your pages has to load, and load times can literally make or break your online business.
For ideal performance, speed must be considered throughout the design process and monitored regularly. However, website performance is a deceptively complex topic, and improving it requires special knowledge of what makes a website fast or slow.
In this guide, we’ll unpack everything you need to know about website performance. First, we’ll discuss what good web performance looks like and why it’s key for any successful website. Then, we’ll examine what affects site performance, and how to make sure your website performs as it should.
Chapters
What is Website Performance?
Website performance measures how quickly the pages of a website load and display in the web browser. Web performance optimization is the practice of improving website performance by various methods — faster websites are said to be higher-performing.
Good website performance is a cornerstone of any successful website because it’s the first event that all visitors experience. First impressions influence how users feel about a website, its associated business or organization, and whether or not they convert, buy, or bounce.
Why Website Performance Matters
As an internet user, you’ve experienced many a slow website. While this might only feel like a minor annoyance, the effects of poor performance can reverberate through an entire business. From user satisfaction to the company’s bottom line, the consequences are far-reaching. Let’s cover the speed benchmarks your website is up against, and why they’re so important to hit.
User Experience
No matter what techniques an online business may use to boost performance, the ultimate goal is always improving the user experience (UX). All website design choices should foster a positive UX, and speed is no exception.
UX impacts every aspect of your website. Simply put, if your website is slow, your visitors will have a bad time. And if your visitors have a bad time, your online business will have a bad time too. Conversely, a high-performing site will improve UX, leave a positive impression on visitors, and encourage them to return.
So, how fast is fast enough for a good experience?
There’s no definitive benchmark for how fast a website must be. There have been multiple numbers thrown around, anywhere from five seconds down to half a second, but perhaps the most influential opinion comes from Google. In 2010 Google stated that a web page must load fully within two seconds for a positive UX, and this is still widely referenced today.
Note that two seconds is a maximum — the fastest websites can load their content in under a second on average. If you’re panicking, don’t worry. With a bit of work, one to two seconds is achievable for almost any website, and certainly for basic ones.
Two seconds is fast, but not arbitrary. When visitors engage with your website, they expect to feel in control. Visitors want your website to deliver exactly what they request as quickly as possible. It has been shown that the average user can wait roughly two to three seconds before feeling disrupted, like they’ve lost control.
Over time, we’ve become conditioned to exceptional website performance. This puts small-time website owners at a disadvantage: When someone lands on your page for the first time, they’re not comparing its load time to those of similar websites — they’re comparing it to the average of every website they’ve seen, including heavy-hitters with entire teams dedicated to performance optimization.
The good news is that you don’t need a large team to hit the two-second threshold. There are clear strategies you can follow to speed things up, and soon we’ll examine what exactly causes slow pages.
Visitor Retention
One main goal of website design is to capture visitor interest as soon as the page loads. But, none of this matters if your website is slow to load in the first place — it’s very easy for users to leave when they feel impatient. Research by Akamai Technologies found that two extra seconds of load time more than doubles a page’s bounce rate, and 53% of mobile users will abandon a page that loads in more than three seconds.
On one hand, it’s great that we’re free to choose the best website for our needs. On the other, it doesn’t feel so great if you’re the one with the high bounce rate. To retain visitors, especially first-timers, your website needs to meet performance expectations.
Conversions and Sales
There’s a strong link between website performance, conversions, and sales. It doesn’t matter how you define a conversion — performance affects visitor satisfaction, and the happier people are using your website, the more likely they are to download a content offer, join an email list, or complete a purchase.
Understanding this relationship is key, as it ties your website’s performance with your bottom line. Small differences in speed can mean the difference between a conversion and a bounce: For every second of load time, your conversion rate is likely to drop by an average of 4.42% within the first three seconds:
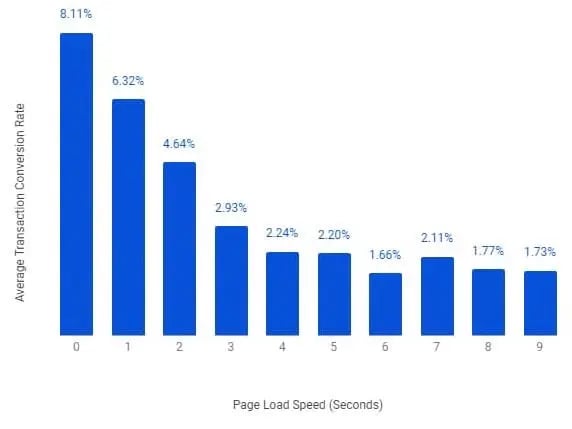
As marketers know, a conversion lost by you is a conversion gained by a competitor — in this case, a competitor with a faster website. All the more reason to prioritize speed.
Brand Perception
Imagine you discover a new restaurant and decide to stop there for lunch. When you arrive, you notice the front door is busted. No big deal, they’ll fix it soon, you think. But, when you return the next week, the door is still broken.
Sure, you’re bothered by the minor inconvenience. Worse than that, though, you may start presuming things about the restaurant — if they can’t fix the front door, what does that say about the quality of the food they make?
The same is true about websites, but to a much greater extent. A noticeably slow website will stir up assumptions that damage your credibility and brand image. Visitors will question your competence, security, and ability to serve the customer. Some might even think your site is unsafe or illegitimate. Every other website they use is fast, so why not yours?
Brand perception is a topic for another post. But, it’s safe to assume that poor perception impedes growth in a competitive online space.
Mobile Experience
Smartphones are slowly but surely taking over the browsing experience. The number of worldwide smartphone users recently surpassed three billion with no signs of stopping, and mobile internet browsing is neck-and-neck with desktop browsing. A quick dip into your analytics may tell a similar story on your website.
The rise of smartphones is perhaps the greatest sea change in web design of the past decade. It’s forced companies to reinvent how they build websites, many now opting for a mobile-first design approach that prioritizes small screens
Mobile-first is more than just layout, though. Mobile devices tend to have fewer computing resources than the standard desktop computer and, as a result, the average web page takes 87% longer to load on mobile than on desktop.
This doesn’t excuse poor performance, however: Half of mobile users will use a business less often if the site isn’t mobile-friendly, even if they like the business otherwise. To serve this growing user base, your mobile website must be built lightweight for smaller devices over slow connections.
SEO
Lastly, website performance has an effect on your place in search results. Since 2010, Google has factored page speed into its ranking algorithm. In 2018, it announced the same for mobile pages. This is one way the search engine rewards websites for providing a better UX.
While page speed is not currently the most decisive ranking factor (Google states that relevance plays a much larger role), it may still impact your website’s place in search results and affect traffic, conversions, and sales. For example, if Google sees your website and a competitor's website as equally relevant to a query, the faster of the two may rank higher.
What Affects Website Performance?
To most, a website feels like a single entity inside our browsers. But, website owners know that there’s much more to it than that.
Many factors come together to deliver a single coherent website, most of which affect web performance in some way. Here are the main components that determine whether a web page is fast or slow, and how each can be optimized:
Page Weight
Page weight refers to the total size of a web page, comprising all the resources (code files, images, embeds, etc.) it needs to load. Load time largely depends on weight — essentially, the more files you include and the larger those files are, the more work the browser needs to do to render it.
Because of how websites are built, many things that slow pages down are based on the frontend, what users see on the page. Take it from former Google Performance Engineer Steve Souders, who writes, “80-90% of the end-user response time is spent on the frontend.”
This idea is illustrated particularly well by a waterfall diagram, one which visualizes how long each resource takes to load completely. As shown below, frontend content is the culprit on a typical web page:
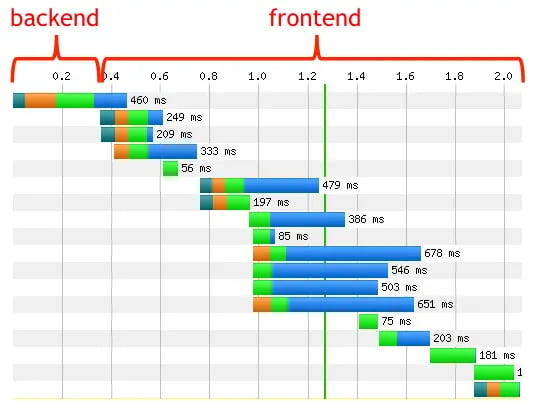
The solution seems simple — trim all excess resources so there’s less to load. While this works, the problem is that frontend technology is becoming too advanced for its own good.
For every new element you place on your page, you’re adding time spent loading its resources. As web professionals are drawn to new dynamic page functions and experiences, load time gets neglected. This is why, surprisingly, websites have been getting slower despite improvements in page delivery technology.
Don’t fall for the gimmicks — simplicity is key for both performance and UX, and you should always favor clean layouts over complexity in your designs. But that’s not the only way to reduce page weight.
Even after simplifying your pages, you might experience stalls in performance due to large files. This is where minification comes in. Minification is the practice of deleting excess characters from files like certain spaces, line breaks, and comments. This information helps developers read the code files but makes no difference to the browsers processing them. Minification is possible with online tools, and WordPress users can leverage speed plugins to minify files automatically.
Images
Most content you see on websites are either text or images. Images files are much larger than plain text HTML files, so they take longer to download and render in the browser. It follows that high-fidelity images will impede an otherwise respectable load time. Luckily, optimizing your images is an easy fix.
Most importantly, don’t go overboard on the number of images you use across your site. Each image is another resource to load, so choose yours intentionally.
Next, resize your images to the desired dimensions before uploading them. Don’t count on your server or the browser to scale them down as this takes extra time. It’s better to upload the same image to your server in multiple dimensions, rather than one large image used in different locations on your website.
Lastly, keep files small by limiting image file formats to JPG, PNG, GIF, and SVG whenever possible. Compressing images may also improve load times, but this is a more subjective process — you want your image files to be small enough to improve performance, but large enough to retain enough quality. This will take some trial and error, but you’ll tend to find that compressing to around 75% of the original image yields the right balance.
HTTP Requests
Every website follows the Hypertext Transfer Protocol, or HTTP. HTTP dictates that for a website to load in a web browser, the browser must first send an HTTP request to the target website’s hosting server. The web server then sends back a response with the requested resource.
In reality, most web pages are complex and require multiple HTTP requests to fully render. As a rule of thumb, the more complex a web page is, the more HTTP requests it needs. And the more requests made, the slower the page.
Reducing HTTP requests may take some time and rethinking of your site, but it could be worth the investment to shave down your load time. Simplifying a page will reduce the amount of requested resources, so start there if you can.
Also, be wary of external resources, resources fetched from third-party servers. External resources can be embeds like images, videos, and other media, as well as external font packs, display ads and affiliate links, and widgets — all require additional HTTP requests to separate servers and may hurt performance.
Browser Caching
Caching is the process of storing data in a place where it can be more easily fetched in the future. A browser cache saves website data like HTML files and images temporarily on the user’s device. When the user returns to the cached web page, the browser loads these files from its local cache instead of requesting them from the web server, saving time and bandwidth.
Browser caching is a must for content that is static on your website for longer periods (content that changes frequently should not be cached). How you enable caching will depend on what services you use to build and host your site, but every provider should offer instructions and explain how to set time limits for cached content.
File Compression
File compression helps deliver files quickly over the web. A web server with compression enabled shrinks down the requested files (without loss of information) before sending them. When a browser receives the compressed files, it decompresses them and renders them as normal.
Smaller files are faster to send and download, so compression is almost always beneficial. Today, 80% of websites use compression, specifically a type of compression called GZIP. Learn how to enable GZIP compression on your server.
Render-Blocking CSS and JavaScript
Web browsers process each page resource one-by-one. Sometimes this means that a file’s code prevents future assets from loading quickly — this is referred to as render-blocking code.
Render-blocking code is typically CSS or JavaScript that, by default, loads before the rest of the page content, even if this code isn’t required for above-the-fold content (i.e. content first visible when the page first loads) to work. Developers can remove or defer render-blocking code to give the impression of better performance.
Hosting
While the majority of web performance optimization practices address the frontend of your website, the right web host is the foundation of a successful, high-performing website. A poor server is subject to flaws and performance issues, so it’s worth the investment for hosting that can handle increasing traffic and spikes in requests.
The low cost of shared hosting may be tempting, but know you’ll be splitting server resources with many other websites — increased activity on any of them affects performance on yours. Choosing a plan above shared hosting will help keep your pages fast at all times.
Geographic Location
With all this tech-speak, it’s easy to forget that servers are computers located somewhere in the world. The larger the distance between the device making HTTP requests and your server(s) completing the requests, the longer your website files will take to send and load. This is why it’s important to know where your servers are being pinged from — your website will likely perform differently in Washington D.C. versus Tokyo.
You can remedy this problem with a content delivery network (CDN). A CDN is a collection of servers distributed around the world that hold cached copies of your website files. When a user requests your website, your CDN will determine the server closest to their physical location and deliver the files from that server.
Permanent Redirects
301 redirects send users from the page they requested to another. As you can guess, the time spent redirecting visitors detracts from performance. There’s not much you can do about this once the redirect is in place, so it’s best to avoid 301s when you can.
How to Check Website Performance
The first step of website performance optimization is measuring how fast your website currently runs. The best way to do this is by conducting an online speed test of your web pages.
These free tests let you paste in the URL of any webpage, and will return a summary of the page performance. Many tests also produce an aggregate score quantifying the overall performance of the page and a rundown of which areas contributed most to a fast or slow performance, so you can pinpoint the most outstanding issues on your website and achieve some quick performance wins.
We’ve listed a few of these speed tests below. As you pick one, keep the following in mind:
- Every tool calculates your performance score differently, so stick to one tool. Viewing results across different tools may give a false impression of improvement.
- Run multiple tests to simulate performance when your website is both cached and uncached by the speed testing tool. Cached websites load faster than uncached ones, so if your website underperforms on your first test, this may be why.
- Your site doesn’t need a perfect score to be considered high-performing — it may not even be possible depending on the resources your page needs. Aim as close to perfect as you reasonably can.
Website Grader
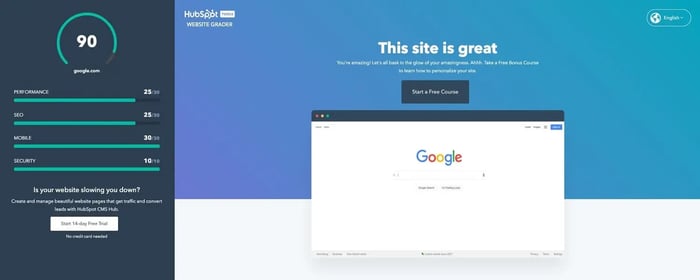
Website Grader provides an aggregate performance score out of 100 which encapsulates the effectiveness of your website. Scoring factors include performance as well as SEO, mobile experience, and security.
Powered by Google’s open-source Lighthouse tool, Website Grader’s performance assessment accounts for 30% of your website score and examines key contributors like page size, number of HTTP requests, caching, and image size. There’s also a free accompanying video course to help you improve your grade.
PageSpeed Insights
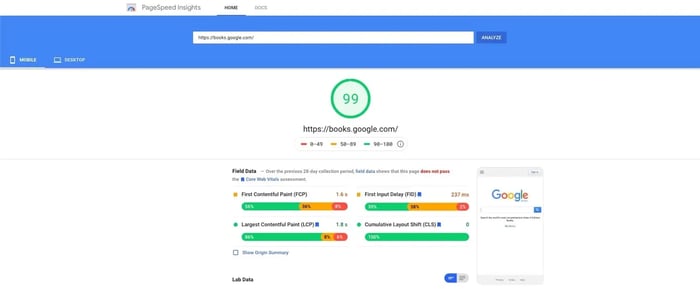
Another popular testing option for marketers, Google’s PageSpeed Insights tool assesses your website performance on both mobile and desktop devices. It provides an aggregate score from 0 to 100 and is powered by Lighthouse — a score of 80 or above is considered high-performing.
PageSpeed Insights is notably rigorous and holds websites up to high standards in terms of performance. It also provides a detailed but accessible report of important metrics, as well as opportunities — suggestions for speeding up your page — and additional diagnostics which may be helpful.
Pulsetic
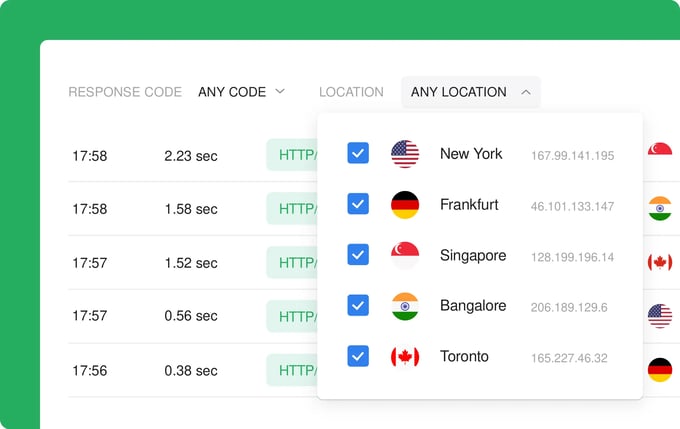
Pulsetic is a global website monitoring tool that provides insight on your website performance including website speed, typical website maintenance, and other customizable reporting ranging from setting headers to response timeouts. For websites with multiple languages and regions, reports will include detailed regional information like uptime and response times.
All of Pulsetic tools allows you to run tests and receive website downtime alerts by phone call, SMS, email, or Slack if your website is down
Pingdom
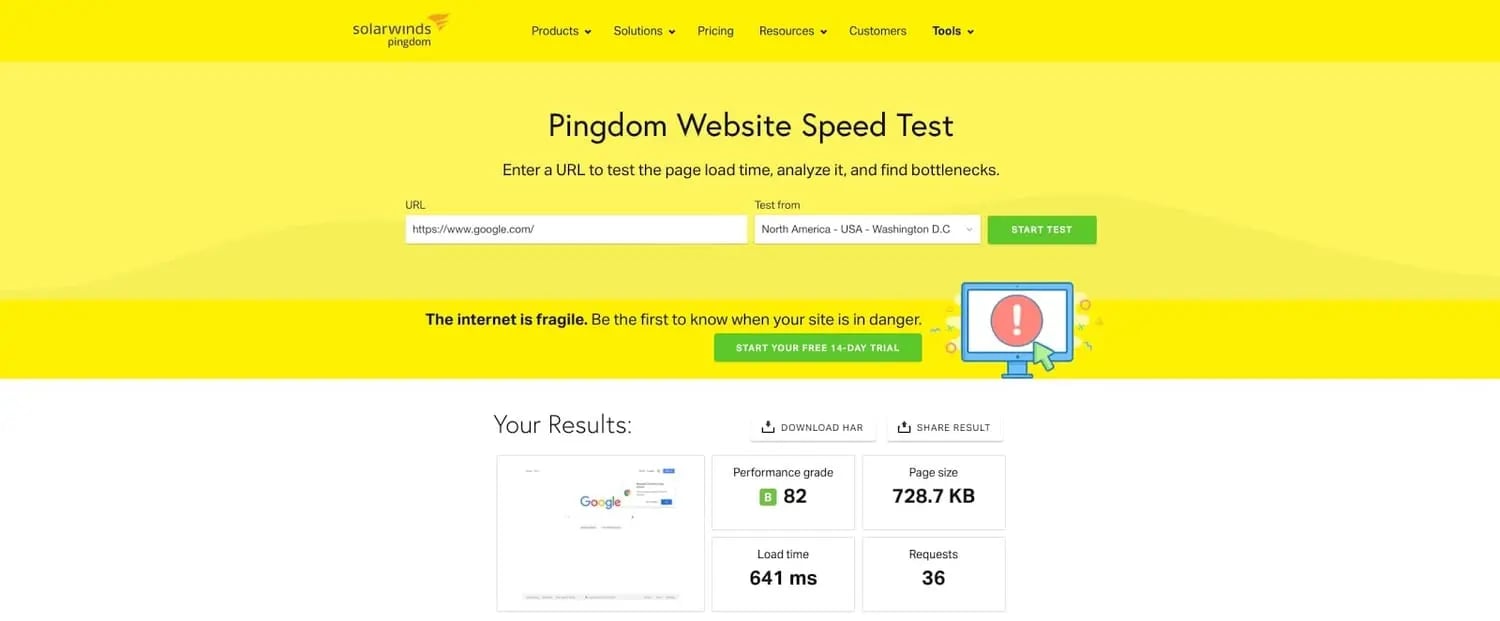
Pingdom is a website monitoring tool that also offers a free website speed test. Its results center on changes you can make to boost performance, and it assigns letter grades to each component enhancing or detracting from load time. It breaks down transfer sizes by file type and number of HTTP requests per content type
Also, Pingdom allows you to run tests from several global locations to simulate how your site performs in these regions.
GTmetrix
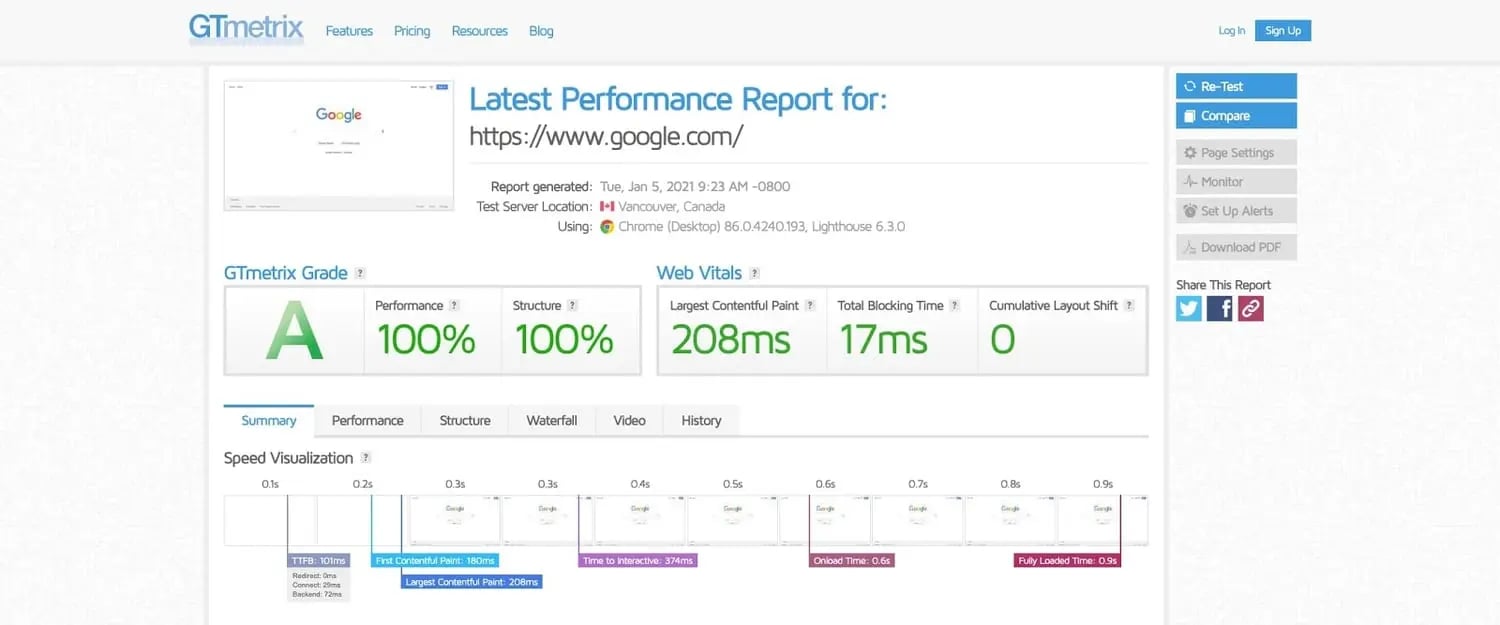
The GTmetrix performance test is one more Lighthouse-powered option — it gives an in-depth summary of performance and suggestions for improvement. It also includes a helpful speed visualization (a timeline of screenshots marking each significant load time event), a content waterfall, video recordings of its tests, and historical performance data for tracking improvements over time.
WebPageTest
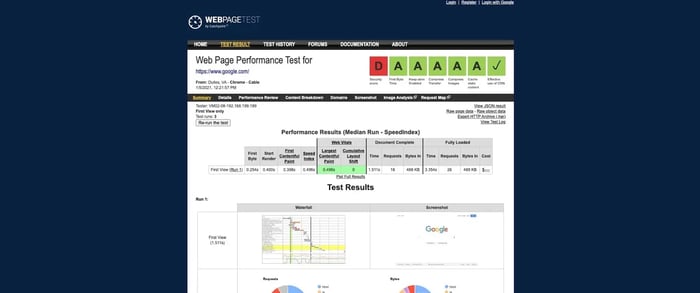
WebPageTest is an open-source testing tool that assesses web performance and security. It runs performance tests on multiple browsers and lets you test from multiple global locations. Less intuitive than other tools, WebPageTest is better for web experts than those seeking quick wins or a brief user-friendly summary. Specifically, its performance breakdown is highly-detailed and its report may take longer to assess than reports with other tools.
Website Performance Metrics
After putting your website through one of the tools above, you might be unfamiliar with some of the terms used to measure performance. While speed is an intuitive concept, performance can’t really be summed up by a single value — there are multiple indicators that web developers use to quantify how “fast” a page actually is. Knowing them, you’ll have a better understanding of how to approach optimization.
Page Load Time
Page load time is the time it takes to load an entire web page completely. It is measured from when a user requests a website (e.g. enters a URL in the browser or clicks a link on a search results page) to when the last resource on the page is rendered. When we say that websites should load in two to three seconds maximum, this is the metric we’re referencing.
Time to First Byte
Time to first byte (TTFB) measures the latency of your web server. It is the time between when a user requests your website and when your web server sends back the first piece of information to the user’s browser.
A slow TTFB indicates an issue with your web server, which can be resolved by upgrading or changing your server plan, or by using a CDN. But first, you’re probably better off focusing on metrics that deal in the frontend, such as...
Time to Start Render
Time to start render is the time it takes for content to begin displaying on the page after a request for the website is sent. It measures how long it takes before the user knows that content is being loaded. This can be signaled by any visual element — like a header, a block of text, or the background — appearing on screen.
This is an important metric, as it tells users that their request is being processed and they’ll see your website soon, which holds their attention. Time to start render usually takes one to two seconds, but top-performing websites hit this mark in under a second.
Time to Title
Time to title is the time it takes for the title of your website to appear in the browser tab, which tells the visitor that your website is loading. The faster the title appears, the better.
Time to Interactive
Another key website performance indicator, time to interactive measures the time from when a user requests your website to when they can start interacting with elements on the page, like scrolling or clicking buttons.
This doesn’t mean that the page is fully loaded — some page elements may still load after others become interactive. Still, if a user can interact with content above the fold, they will consider the page ready to use.
DNS Lookup Time
DNS lookup time is how long it takes for the Domain Name System (DNS) to convert the domain name entered by the user into the corresponding IP address. This must be done to retrieve the resources from each hosting server.
DNS lookup should be very short, no more than 150 milliseconds — anything longer can noticeably impact performance. A lengthy DNS lookup time could be caused by your DNS provider, in which case you might consider a premium DNS service. It may also be due to the number of third-party resources on your web page. For example, if your page includes content from two third-party resources, the DNS will need to translate three domains (including your own) into IP addresses, inflating your total DNS lookup time.
User-Based Metrics
These metrics aren’t direct measurements of website performance, but can be good indicators. If you see these dwindling, look into your page speeds.
Bounce Rate
A page’s bounce rate is the percentage of people who land on the page, then leave without clicking anything. If a page is slow to load, it makes sense that a higher number of visitors will be impatient and leave without interacting. But, remember that high bounce rates can be caused by many things — your page might load fine but fail to capture interest.
Session Duration
Session duration (also called “time on site”) is another sign of potentially slow pages. If it skews very low, this may indicate that many users aren’t getting past the first-page load.
Conversion Rate
Conversion rate is the percentage of the total visitors to your website that complete a conversion. As discussed, conversions are closely linked to website performance — happy visitors are more likely to stay on your website and complete some desired action. Like bounce rate, many factors influence your conversion rate, but it’s worth investigating to see if performance is one of them.
Error Rate
Error rate is the proportion of HTTP requests that return error codes among all HTTP requests over a short period. A high error rate indicates something is wrong with your web infrastructure that prevents resources from being delivered, slowing or stalling pages and turning visitors away.
Website Performance Monitoring Tools
After resolving any current outstanding performance issues, it’s recommended you monitor your website performance on a regular basis. This means checking that your website continues to load pages quickly and consistently.
Website performance monitoring comes in two types, real user monitoring and synthetic monitoring. Real user monitoring, also called passive monitoring or reactive monitoring, tracks user activity and records in detail how your website performs for real users. Synthetic monitoring, also called active monitoring or proactive monitoring, uses software to simulate real user interactions at routine intervals. This helps uncover performance issues before they affect real visitors.
Both real user monitoring and synthetic monitoring require specialized monitoring software, and several cloud-based solutions exist for active and reactive monitoring. Here are some standout options:
Pingdom
Pingdom is a top player among website monitoring tools, and is acclaimed for its reliability and up-to-the-minute alerts issued when your website is down or performing below benchmarks. This service also offers synthetic monitoring to discover performance problems and a user-friendly interface that allows website owners of any experience level to keep tabs on their sites.
Pingdom prices its service on a scale and splits its plan into synthetic and real user monitoring services. Synthetic monitoring starts at $10 per month for 10 uptime checks (i.e. checking that your website is available) and one advanced page speed check. Real user monitoring starts at $10 per month for 100,000 page views.
Uptrends
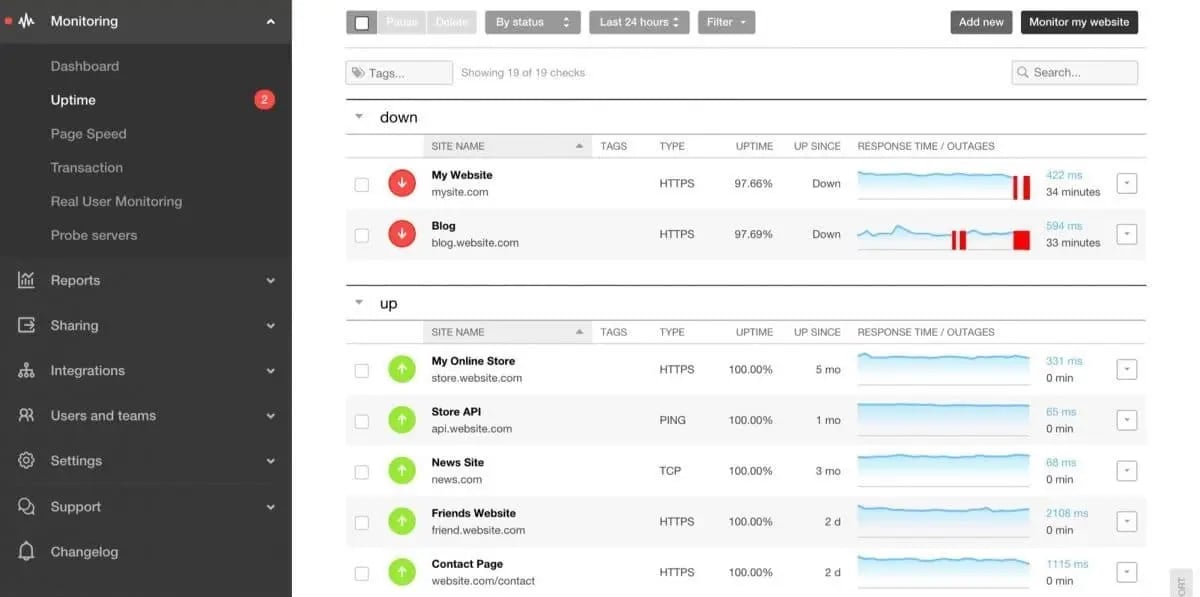
Uptrends is another popular monitoring tool that includes solutions for proactive and reactive website monitoring. It allows you to automate performance tests from 224 global locations in intervals of up to one minute, and its visual reports are highly intuitive and visually engaging. If you want a tool that shows you everything you need to know in a simple interface, try a demo.
Uptrends is priced across five tiers, from the Starter plan ($15.47 per month) and the Business plan ($37.06 per month) up to the Professional plan ($216.65 per month). Features vary widely per plan, allowing you to select one best suited and switch plans as your website scales.
Site24x7
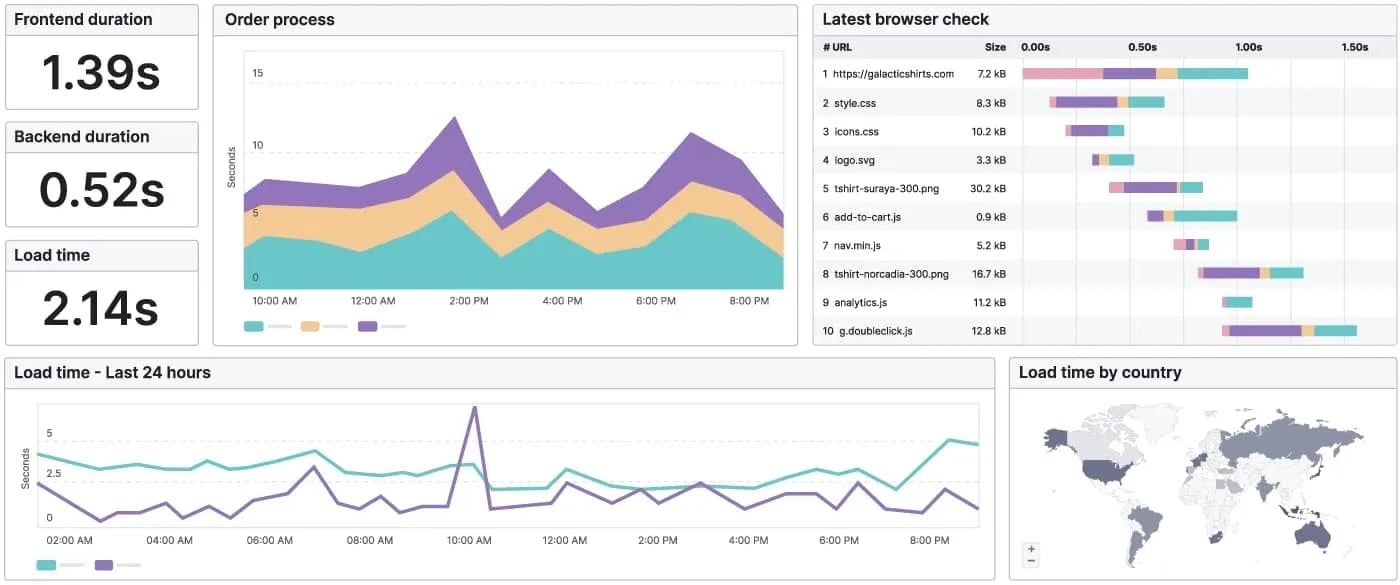
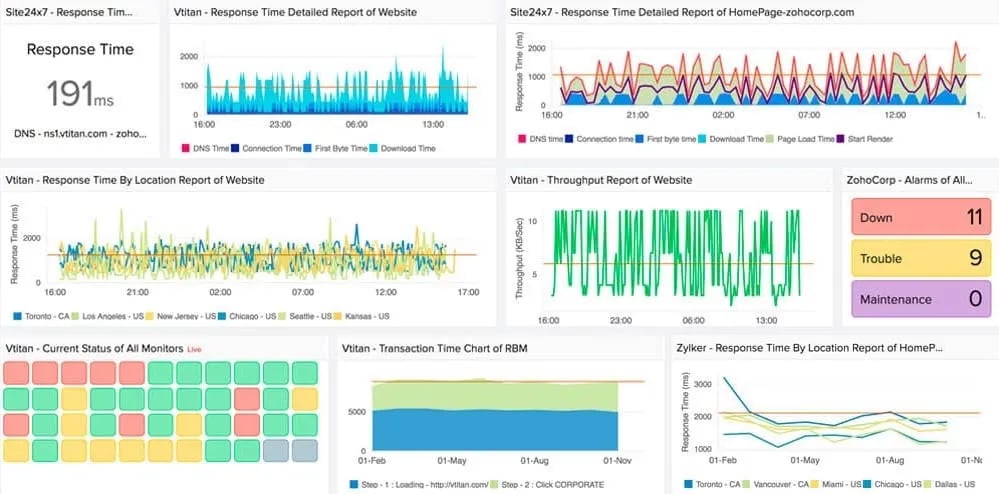
Site24x7 provides a comprehensive suite of tools for website monitoring as well as server monitoring, application performance monitoring, and more. You can leverage its global network of over 100 monitoring locations to simulate web page interactions and track your site’s performance and uptime. Site24x7 can also conduct security audits and API monitoring — it’s a lot to take in, which may make this powerful option feel overwhelming for new users
Plans range from $9 per month to $89 per month with increasing permitted websites and synthetic tests and pageviews by tier. There’s also an enterprise plan and a 30-day free trial.
TeamViewer
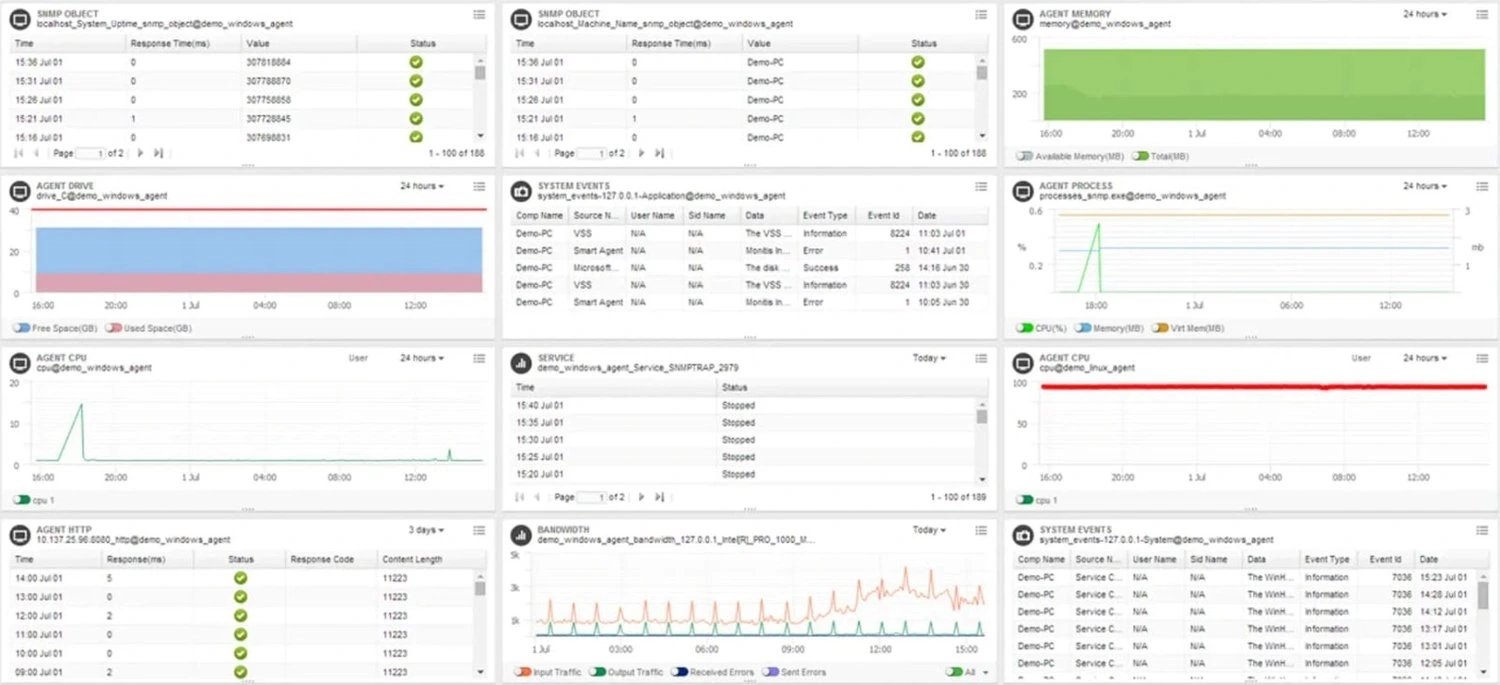
The TeamViewer Remote Management tool (previously Montis) is our final recommendation. It’s centered on page performance — you can check page speeds from over 30 global locations and generate visual reports for each check. Performance checks can be set to run as frequently as you want, and you can also program alerts if performance drops below a set threshold. One drawback is that the user interface isn’t as striking as competitors.
The price of a TeamViewer subscription scales based on the number of tracked URLs — for example, 10 URLs is $18.55 per month, while 100 URLs will run you $153 per month.
Improve Your Website Speed
Every website takes a different approach to its design based on its goals, industry, and audience. However, good website performance is a universal must for all websites, no matter the niche, service, or content.
Slow load times are more than just an annoyance for your users — they impact how your audience views your brand and how likely they are to make a purchase and recommend you to a friend. A slow website is also bad for SEO and mobile traffic. And, if your pages perform poorly, every single visitor is affected.
To sum up, website performance optimization more than just making things faster — it’s about strengthening your entire online presence and creating a website that visitors trust. While major performance gains may not happen overnight, the data shows that fractions of a second make all the difference.


![The HubSpot Blog’s 2023 Web Traffic & Analytics Report [New Data]](https://blog.hubspot.com/hubfs/Web Analytics Traffic.png)


